Clema heat injury data · updated October 2026 · OSHA records through November 2025

Workplace heat injury statistics: about 200 hospitalizations a year, and that’s the floor.

We went through every serious injury employers reported to federal OSHA since 2015 and pulled out the heat cases. There were 2,628, covering 2,631 workers admitted to hospital. Here’s what stood out.

2,628heat-related hospitalization reports to federal OSHA, January 2015 to November 2025.
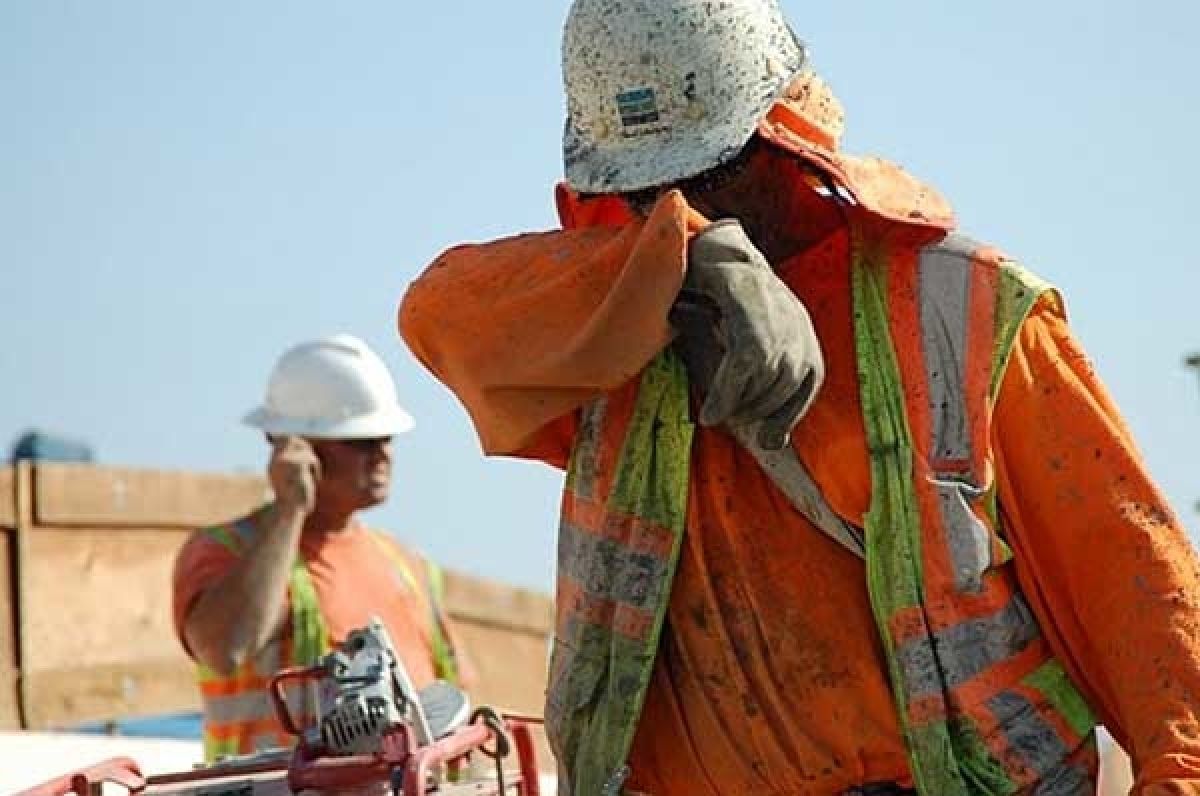
A worker in a hard hat wiping sweat from his face in the sun
Every one of these reports is someone who didn’t make it to the end of the shift.

Three things the data shows.

About 200 to 250 a year, every year.

Heat makes up 2% to 3.4% of all severe injuries reported to OSHA. The count peaked in 2016 and 2019, dipped in 2020, and has run between 173 and 248 a year since 2021. It hasn’t fallen.

Heat-related severe injury reports to federal OSHA by year, 2015 to 20252015: 215. 2016: 340. 2017: 230. 2018: 293. 2019: 315. 2020: 181. 2021: 173. 2022: 201. 2023: 248. 2024: 205. 2025 (January to November): 227.0120240360Heat emphasis program, Apr 202221520153402016230201729320183152019181202017320212012022248202320520242272025*

* 2025 covers January 1 to November 30, the latest data OSHA has published.

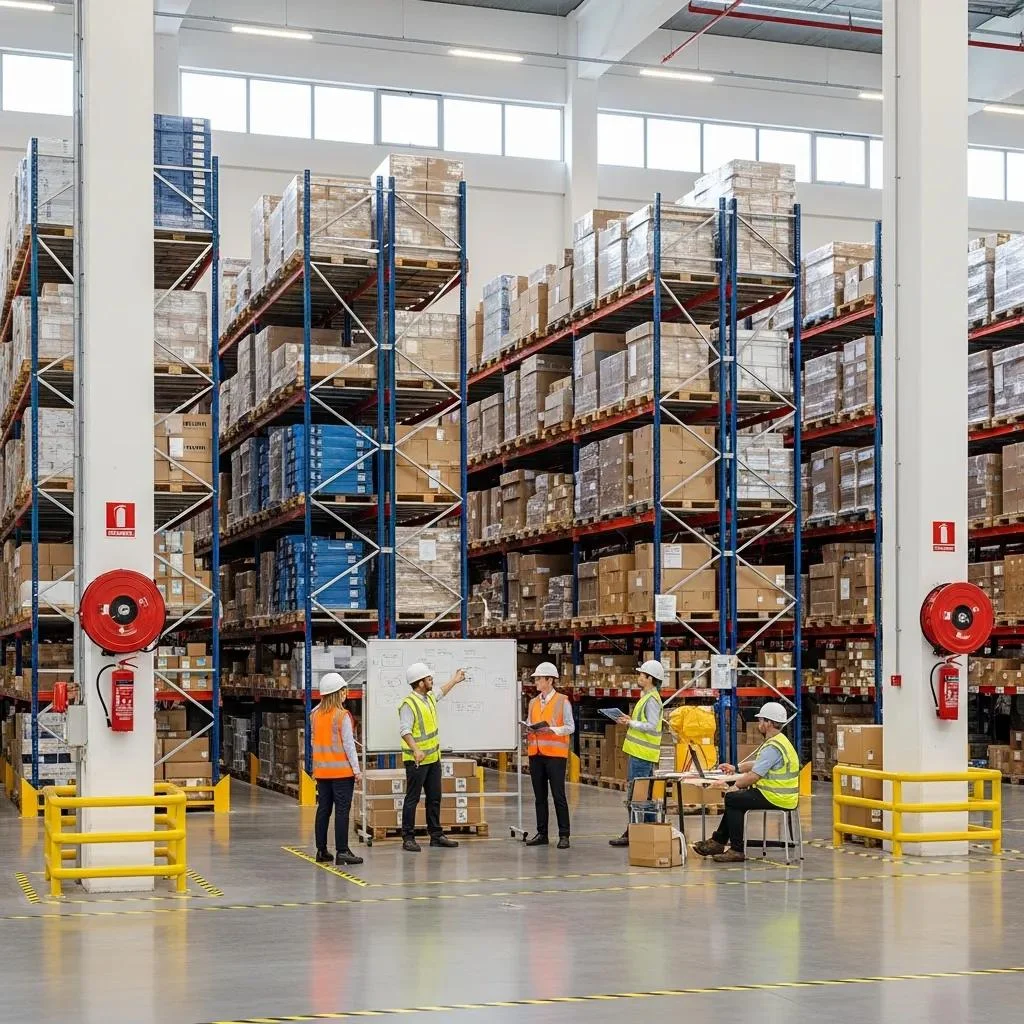
Workers in hi-vis vests on the floor of a large warehouse with tall shelving
Indoor heat is real heat. Big buildings trap it.

One in eight happened indoors.

OSHA started recording whether heat exposure was indoors or outdoors in 2024. Since then, 53 of 432 heat hospitalizations happened inside: warehouses, plants and kitchens without air conditioning.

Outdoor 324Indoor 53Not specified 55

That’s the gap indoor rules like Cal/OSHA’s and Minnesota’s are written for. See also cooling for warehouse crews.

Why the real number is higher.

Federal OSHA only

California, Washington, Oregon and other state-plan states mostly report elsewhere. Only 127 of 2,628 reports come from them.

Serious cases only

These are hospitalizations. Heat illness treated and sent home isn’t here.

No deaths

Fatalities are reported separately and aren’t in this file.

Under-reported

Employers have 24 hours to report, and heat is often recorded as something else, like a fall or a cardiac event.

Use the data.

Free to reuse under CC BY 4.0. Please credit Clema and link here.

Clema. “Workplace Heat Injury Statistics: OSHA Data 2015–2025.” Analysis of OSHA Severe Injury Reports, January 2015 to November 2025. October 2026. https://www.clemacooling.com/workplace-heat-injury-statistics
How we counted

Source. OSHA’s public Severe Injury Reports file, January 1, 2015 to November 30, 2025 (105,996 reports; file dated July 23, 2026; downloaded October 20, 2026).

What counts as heat. Reports OSHA coded as exposure to environmental heat (OIICS 531, or 5310 to 5312 from 2024). Heat burns are excluded. Adding heat-illness diagnosis codes and narrative keywords changes yearly counts by only 0.8% to 5.7%.

Fields. Year from the event date, state from the report, industry from the employer’s primary NAICS code, inspection link from the report’s inspection number.

Questions people ask about this data.

How many workers are hospitalized for heat at work each year?
Employers reported between 173 and 340 heat-related severe injuries a year to federal OSHA from 2015 through 2024, and 227 from January to November 2025: 2,628 reports covering 2,631 hospitalized workers since 2015. These are floor numbers that exclude deaths, state-plan states and unreported cases.
Which industries and states have the most heat injuries?
From 2021 to November 2025, construction had the most (241), followed by transportation and warehousing (225). By state, Texas (246) and Florida (216) together account for 43.8% of reports in federal OSHA states.
Are heat injuries at work underreported?
Very likely. Severe Injury Reports depend on employers reporting hospitalizations within 24 hours, OSHA's own heat rulemaking discusses underreporting, and heat is often recorded as another condition. Treat these counts as a minimum.
Can I use this data?
Yes. The tables are free to reuse under CC BY 4.0 with credit to Clema and a link to this page. Download the CSVs above.

First batch sold out · limited 2027 deployment

Keep your crew out of these numbers.

Early AccessROI calculator