Clema heat injury data · OSHA records through November 2025

Heat injuries by industry: one in six is a delivery worker.

Ask anyone to picture heat illness at work and they’ll describe a roofer. The OSHA records add a second picture: mail carriers and package couriers account for 177 of the 1,054 heat hospitalizations reported from 2021 through November 2025. Construction still leads, at 23%.

1 in 6heat hospitalizations reported to OSHA involves a Postal Service or courier worker.

A delivery driver with a clipboard beside an open van full of packages
Routes run through the afternoon peak, usually alone.

Construction leads. Delivery is right behind it.

Construction still has the most heat hospitalizations, 241 of the 1,054 reported from 2021 through November 2025. Transportation and warehousing is only 16 behind, and factories aren’t far off. Heat is no longer an outdoor-trades problem.

Construction22.9% of all
241
Transportation and Warehousing21.3% of all
225
Manufacturing16.9% of all
178
Admin, support and waste services12.0% of all
126
Utilities3.3% of all
35
Retail Trade3.3% of all
35
Wholesale Trade3.2% of all
34
Agriculture, Forestry, Fishing and Hunting2.9% of all
31

Source: Clema analysis of OSHA Severe Injury Reports, federal OSHA jurisdiction, January 2021 to November 2025 unless noted. Full method and CSVs on the heat injury statistics page.

Two construction workers in hard hats and hi-vis talking on a building site
Specialty trades alone account for 137 reports, 13% of the total.

Zoom in and two delivery jobs stand out.

Break the numbers down by subsector and the Postal Service (89) and couriers and messengers (88) rank second and third, behind only specialty trade contractors: the roofers, electricians, HVAC, concrete and framing crews.

Delivery work has a particular shape. Routes run straight through the afternoon peak, and a driver is usually alone, so there’s nobody nearby to notice the early signs.

Specialty Trade ContractorsNAICS 238
137
Postal ServiceNAICS 491
89
Couriers and MessengersNAICS 492
88
Administrative and Support ServicesNAICS 561
86
Heavy and Civil Engineering ConstructionNAICS 237
74
Waste Management and Remediation ServicesNAICS 562
40
UtilitiesNAICS 221
35
Construction of BuildingsNAICS 236
30
Primary Metal ManufacturingNAICS 331
25
Fabricated Metal Product ManufacturingNAICS 332
23

Factories: 178 reports

Manufacturing is third by sector. Metal plants show up most, with primary metals (25) and fabricated metal products (23) near the top. See manufacturing.

Support services: 126

A broad category that includes staffing agencies, landscaping and waste collection crews. Temporary and new workers are the least acclimatized people on any site.

Utilities: 35

Small in raw numbers, but line and substation crews work long storm-restoration shifts in full PPE. See utilities.

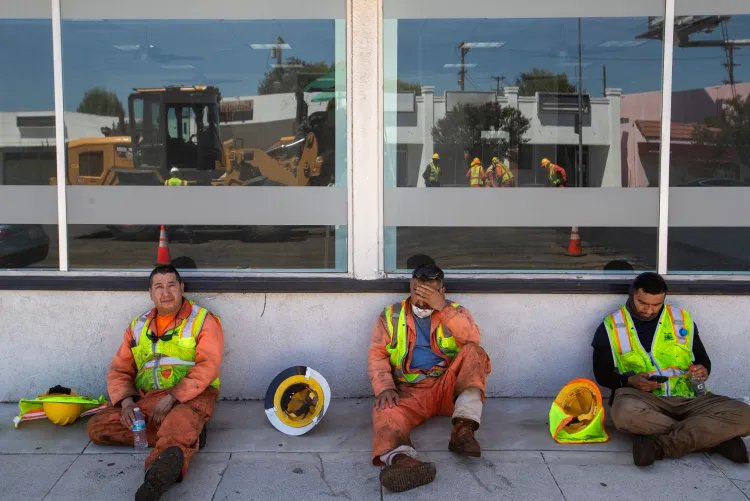
Three construction workers in hi-vis sitting on the ground in the shade during a heat break
Shade and scheduled rest only help if they actually happen.

What this means for your crew.

Whatever the industry, the controls that work are the same, and most cost nothing.

  • Ramp new and returning people up. Most serious heat cases hit in the first days on the job. Use a written acclimatization schedule.
  • Measure heat where the work is, and set work/rest by it. WBGT limits tell you more than the forecast.
  • Nobody works the hot hours unwatched. Buddy checks, radio check-ins for solo workers, and supervisors who know the signs (heat stress training).
  • Write it down. A site-specific heat illness prevention plan is the first thing an inspector asks for.

More from the data.

Questions people ask about this data.

Which industry has the most heat injuries?
Construction, with 241 of the 1,054 heat-related severe injuries reported to federal OSHA from 2021 to November 2025 (22.9%). Transportation and warehousing is close behind with 225 (21.3%), then manufacturing with 178 (16.9%).
Are delivery drivers at high risk of heat illness?
The OSHA records suggest so. The Postal Service (89) and couriers and messengers (88) together account for 177 heat hospitalizations from 2021 to November 2025, about one in six of all reports, second only to specialty construction trades at the subsector level.
Why does manufacturing show up so high?
Indoor heat from furnaces, ovens and process equipment can be as dangerous as summer sun, and many plants are not air conditioned. Manufacturing accounts for 178 heat hospitalizations from 2021 to November 2025, with metal manufacturing near the top.

First batch sold out · limited 2027 deployment

Keep your crew out of these numbers.

Early AccessROI calculator